Numbers about loyalty programs are everywhere — and often contradictory. Vendors cite the metrics that flatter their platforms. Chains publish data that supports their investor narratives. The research that actually matters — data on consumer behavior rather than brand aspirations — tells a more complicated story.
This article aggregates publicly available research on restaurant loyalty programs: enrollment trends, engagement rates, redemption behavior, generational differences, and revenue impact. The goal is a baseline reference for operators, analysts, and engaged consumers trying to separate signal from marketing noise.
Loyalty Program Enrollment: How Many Members Is Too Many?
American consumers are enrolled in a striking number of loyalty programs. Research from Bond Brand Loyalty’s Loyalty Report — one of the longest-running annual studies on program participation — has consistently found that the average U.S. consumer belongs to more than 16 loyalty programs across all categories, including retail, travel, financial services, and food service.
The problem embedded in that statistic is engagement, not enrollment. Being a member of a program and actively using it are different behaviors. The same research tracks what Bond calls “active” membership — programs in which the consumer engaged at least once in the prior 12 months — and the active participation rate consistently runs well below total enrollment. Many consumers join programs at the point of sale, collect a sign-up bonus, and never engage again.
For restaurant specifically, the National Restaurant Association has tracked loyalty program adoption as part of its annual State of the Restaurant Industry reporting. NRA data from recent years has shown that a significant majority of adults — typically in the 55–65% range — belong to at least one restaurant loyalty program. That’s a high penetration rate relative to earlier periods, driven largely by the rapid app rollout across QSR and fast casual chains during the late 2010s and early 2020s.
What those enrollment numbers don’t capture is the concentration effect: a small percentage of members — often cited as the top 20–30% — drive a disproportionate share of both visits and redemptions. Loyalty program economics look dramatically different when you disaggregate the high-frequency core from the infrequent periphery.
Visit Frequency Impact: What Research Actually Shows
The question operators care most about is straightforward: does having a loyalty program make customers come back more often? The honest research answer is “yes, but with important caveats about causality.”
Oracle’s Food and Beverage division published research indicating that loyalty program members visit significantly more frequently than non-members — in some measurements, up to 35% more often. Paytronix, a major loyalty platform provider, has published similar findings showing that enrolled and active members outperform non-enrolled customers on visit frequency and average check size.
The causality problem is significant. Loyalty programs attract and retain frequent customers — but they don’t necessarily create them from scratch. A program that shows its members visiting 40% more often than non-members may simply be reflecting the fact that frequent customers were more likely to enroll in the first place. True incrementality measurement — whether the program itself caused additional visits versus simply identified high-frequency customers — requires more sophisticated experimental designs than most brands publish publicly.
What’s better-established is the engagement-frequency relationship within programs. Paytronix data has shown that members who regularly redeem rewards visit substantially more often than members who never redeem — suggesting that completing the reward cycle (earning, then cashing out) reinforces the habit loop more effectively than merely accumulating points. Programs that never see redemption from a significant portion of their member base may be measuring loyalty without actually delivering it.
Redemption Rates: The Metric Brands Rarely Feature
Redemption rate — the percentage of issued loyalty currency that members actually use — is one of the most revealing indicators of program health. Low redemption rates mean large breakage pools: accumulated value that consumers never capture. High redemption rates indicate members understand the program and find the rewards achievable and appealing.
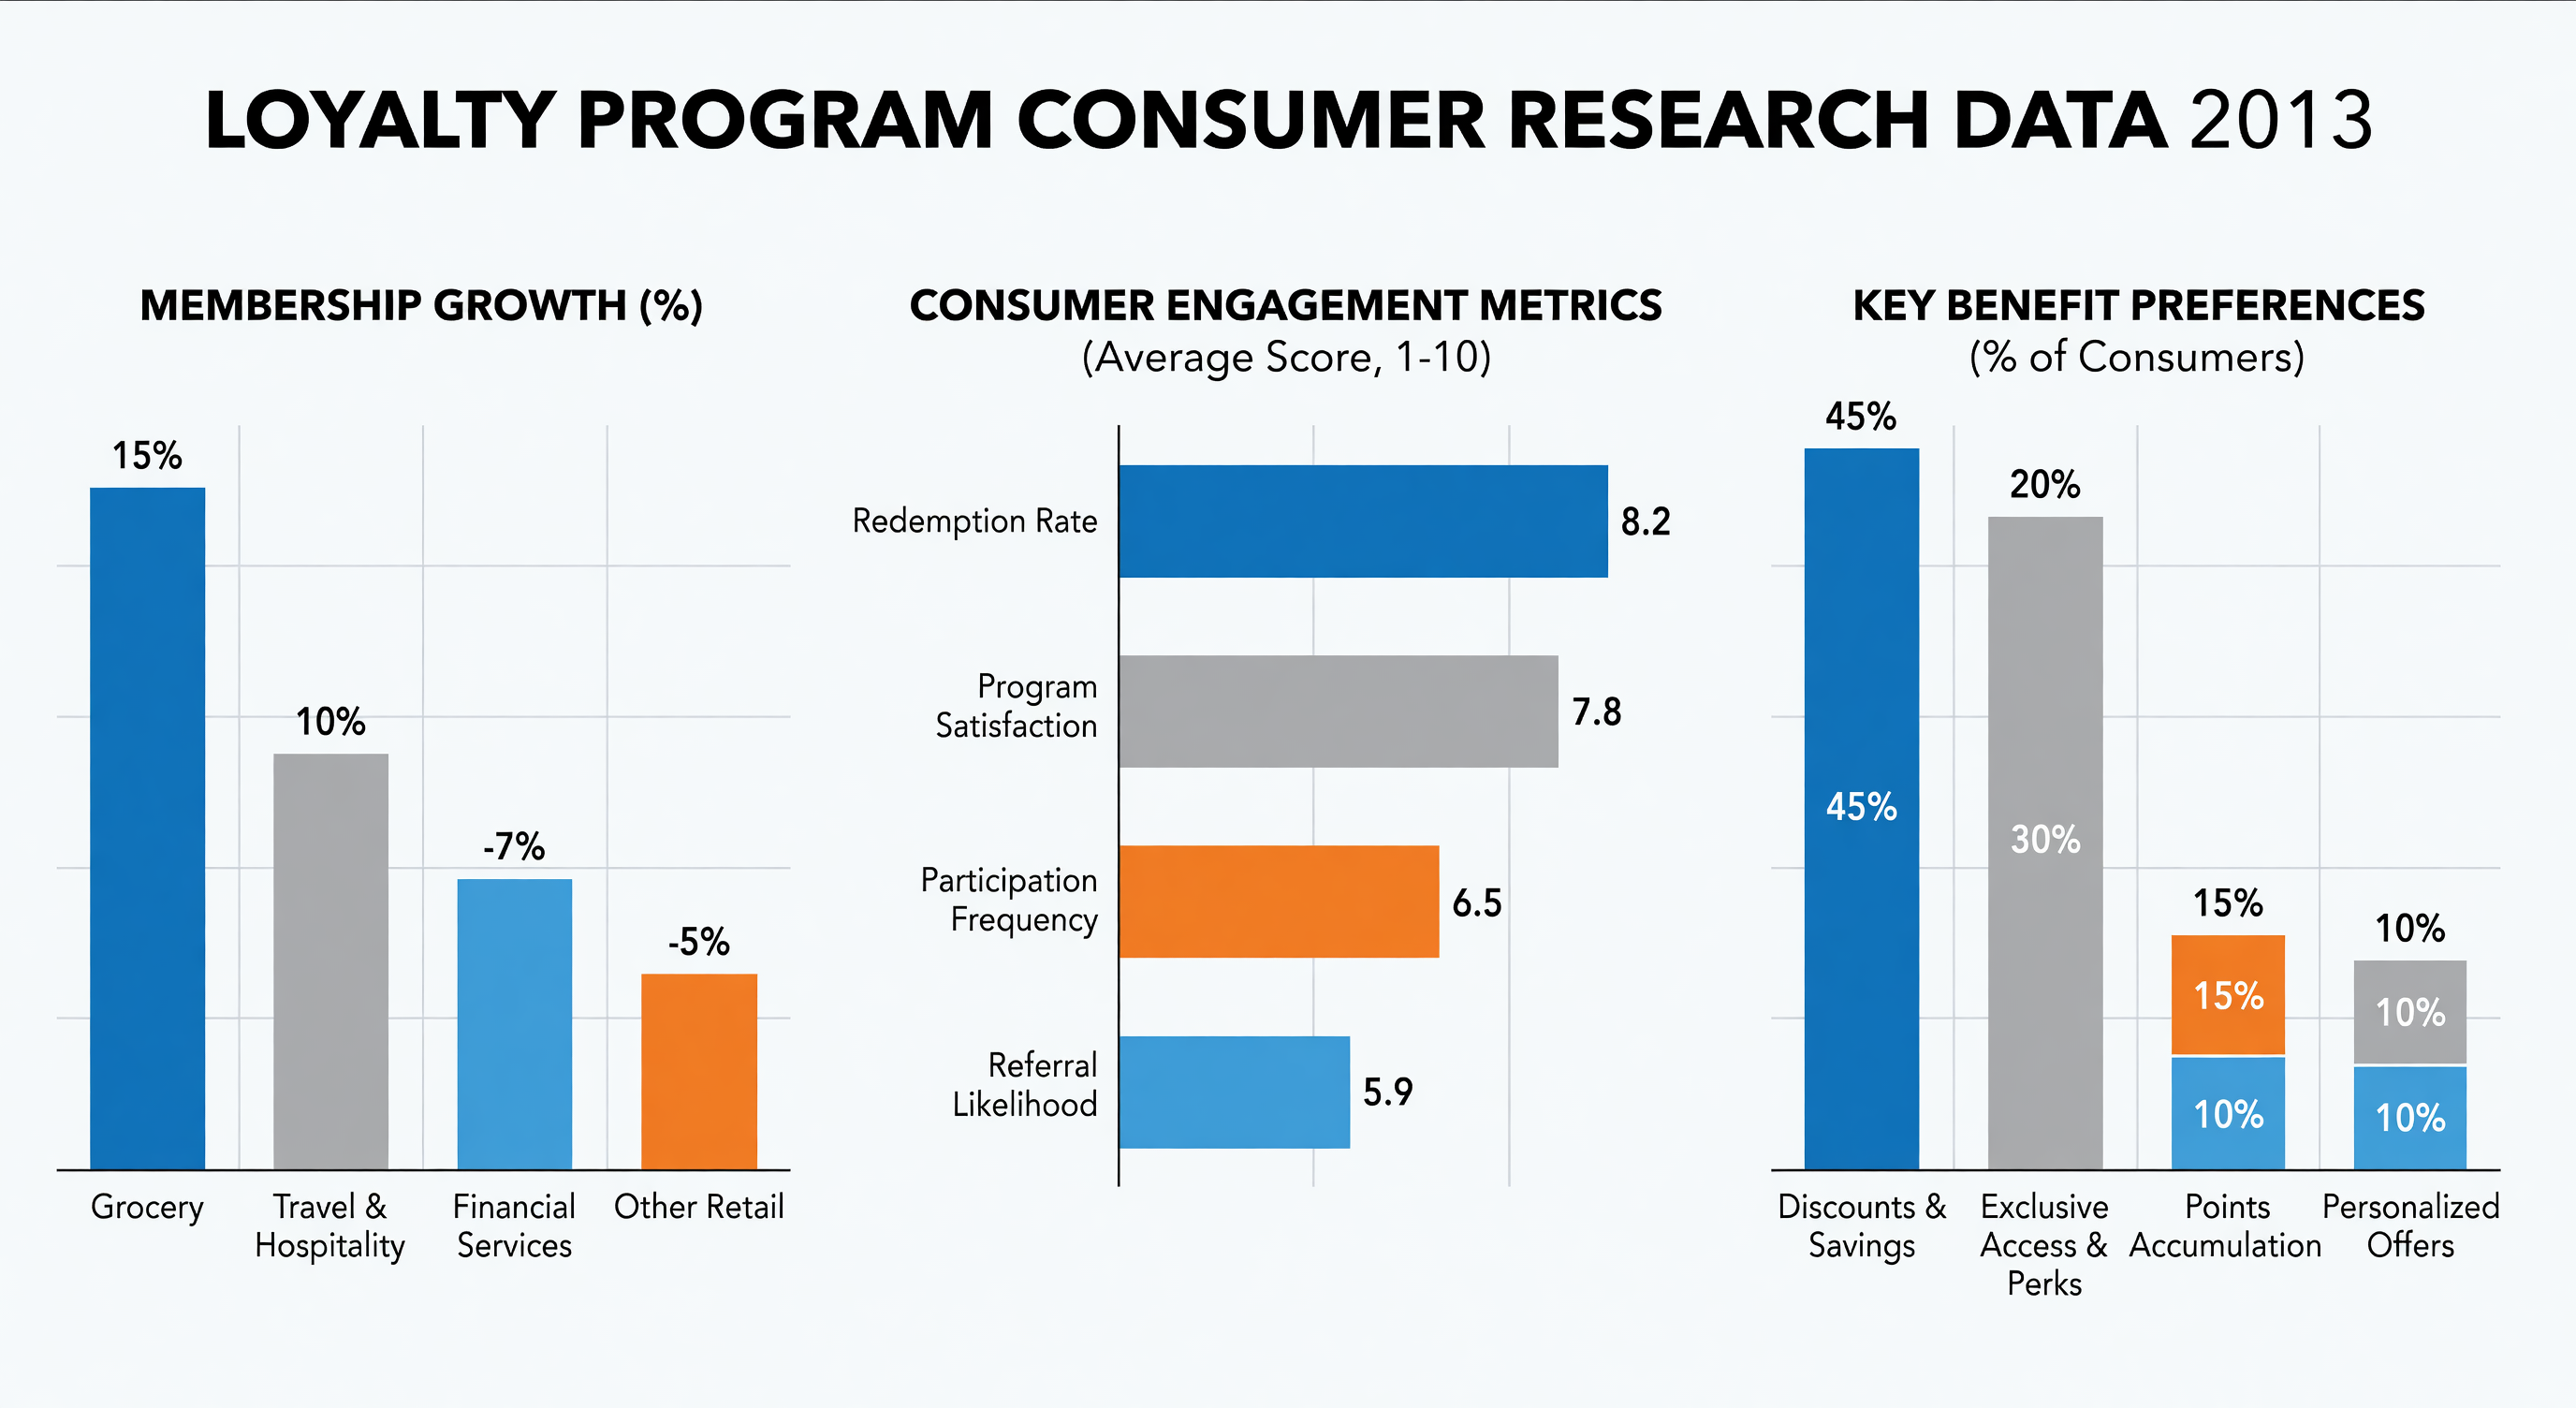
Industry redemption rates vary significantly by program design. Paytronix’s annual loyalty benchmarking data has shown redemption rates for restaurant programs ranging from below 20% for poorly designed programs to above 50% for programs with low earn thresholds and high reward clarity. The median across the restaurant segment has typically landed in the 30–40% range, though this varies substantially by segment (QSR vs. casual dining vs. fine dining) and by whether the program is primarily app-based.
Programs with frequent, low-value redemption options tend to outperform those requiring large point accumulations before any reward unlocks. The psychological principle at work is documented: consumers respond better to frequent small wins than to the prospect of a large reward requiring sustained effort over months. Starbucks has built much of its program success on this insight, offering redemptions starting at 25 Stars — a threshold reachable in a handful of visits.
Mobile App Adoption and Its Relationship to Loyalty Engagement
App-based loyalty programs have higher engagement rates than card-based alternatives, and by most measures, significantly higher program revenue per member. The mechanism is partly direct (app users earn at higher rates, access bonus offers, and order more frequently via mobile order-ahead) and partly behavioral (the app creates a habitual touchpoint that the restaurant can activate with notifications).
Starbucks has been the benchmark for measuring this effect. In years when Starbucks has reported loyalty metrics, app-based members have consistently represented a disproportionate share of both total transactions and total revenue — the company has reported that loyalty members account for roughly 40–50% of its U.S. company-operated revenue, with the app being the primary channel for those transactions.
Broader industry data from Incisiv and similar retail technology research firms has consistently shown that restaurant chains with robust mobile loyalty integrations outperform those without on repeat purchase rate and average check. The app functions as the distribution layer for personalized offers, and personalization — even rudimentary personalization based on order history — measurably improves offer redemption rates compared to generic promotions.
Generational Differences in Loyalty Program Behavior
Generational variation in loyalty program engagement is real and relevant to program design decisions. The differences aren’t always what conventional wisdom suggests.
Millennials (broadly, adults in their mid-20s to early 40s) consistently show the highest enrollment and active participation rates across research studies. KPMG consumer research has documented that Millennials over-index on loyalty program membership relative to older generations — they’re more likely to join, more likely to engage actively, and more likely to cite program membership as a factor in restaurant selection. The Millennial relationship with loyalty is partly generational (they came of age during the rise of app-based programs) and partly demographic (they over-index on QSR and fast casual, the segments where loyalty is most prevalent).
Gen Z engagement is high but distinct in character. Bond Brand Loyalty data has shown Gen Z members respond more strongly to social and experiential rewards than to transactional discounts — free menu items matter, but exclusive access and in-app experiences also carry weight. Gen Z’s relationship with restaurant loyalty also intersects heavily with delivery platform loyalty, which creates split attention between brand-owned programs and third-party ecosystems like DoorDash DashPass.
Boomer-age consumers (adults 60+) show lower enrollment but higher redemption rates among those who do join — a finding consistent with research on consumer frugality and follow-through behavior. The barrier for Boomers is frequently the mobile-first design of modern programs, not the underlying value proposition. Programs that maintain non-app participation pathways retain access to an older demographic that often has high disposable income and significant frequency in casual and family dining segments.
Revenue Contribution of Loyalty Members
The most strategically significant statistic in restaurant loyalty research is the revenue contribution of members versus non-members. Several large chains have shared investor-facing data that puts loyalty member revenue contribution at meaningful percentages of total sales.
Starbucks has cited loyalty member spending representing approximately 40–50% of U.S. company-owned store revenue. Chick-fil-A has reported that members of its Chick-fil-A One program account for a substantial portion of digital orders, though the company releases limited detailed metrics. Texas Roadhouse, which launched its program more recently, began reporting loyalty engagement as part of its investor narrative almost immediately upon launch.
The revenue concentration figure matters because it shapes how operators should think about program investment. If loyalty members generate 40% of revenue, the math on what you can spend to acquire and retain them becomes very different. It also highlights a vulnerability: loyalty programs create a customer segment that the operator knows extremely well — but that segment can be poached by competitors who offer better programs or simply better food.
The overall research picture on restaurant loyalty is one of genuine impact, significant design variation, and substantial measurement challenges. The programs that work tend to have low redemption thresholds, transparent value, strong app integration, and genuine personalization capability. The programs that don’t work tend to have the reverse profile — high earn requirements, opaque value, and minimal differentiation from a simple discount program.
Frequently Asked Questions
How many loyalty programs does the average American consumer belong to?
Research from Bond Brand Loyalty has consistently found that U.S. consumers belong to more than 16 loyalty programs across all categories on average. For restaurant-specific programs, the National Restaurant Association has documented that roughly 55–65% of U.S. adults belong to at least one restaurant loyalty program. Active participation rates are significantly lower than enrollment rates across all program types.
Do restaurant loyalty programs actually increase visit frequency?
Research consistently shows loyalty members visit more often than non-members, with some studies showing differences of 30–40% in visit frequency. The caution is causality: frequent customers self-select into programs, which inflates the observed difference. Experimental studies designed to measure true incremental visits are less common and show more modest effects. The engagement-redemption cycle — earning and then actually redeeming — appears to reinforce visit behavior more than passive membership alone.
What is a typical redemption rate for restaurant loyalty programs?
Paytronix benchmarking data and similar research suggests restaurant loyalty redemption rates typically range from below 20% for poorly designed programs to above 50% for programs with low thresholds and high clarity. Median performance tends to cluster in the 30–40% range. Programs with frequent, low-value reward options substantially outperform those requiring large accumulated balances before any redemption is possible.
Are younger consumers more engaged with restaurant loyalty than older consumers?
Millennials show the highest enrollment and active engagement rates. Gen Z engages at high rates but responds more strongly to experiential and social rewards alongside transactional discounts. Boomer-age consumers show lower enrollment but tend to have higher redemption rates when they do join — suggesting the barrier is program design and app requirements, not disinterest in the underlying value proposition.
What percentage of restaurant revenue comes from loyalty members?
This varies significantly by chain and segment. Starbucks has cited loyalty member spending representing roughly 40–50% of U.S. company-owned store revenue — a figure that reflects both their program’s depth and the high visit frequency of their core customer base. Other chains report lower percentages, with many QSR and fast casual brands seeing loyalty members account for 20–35% of digital-channel revenue. The metric is difficult to compare across brands because of different definitions of what constitutes a “loyalty member.”
Further Reading from Authoritative Sources
- National Retail Federation — NRF and the National Restaurant Association produce the primary industry data on restaurant loyalty program participation rates cited throughout this article.
- Harvard Business Review — HBR publishes behavioral economics research on reward psychology that explains why low-threshold frequent redemption programs outperform high-threshold accumulation programs.