For most casual dining and quick service operators, the central question about a loyalty program is not whether guests will sign up. Enrollment is the easy part. The harder question is whether enrolled members behave differently than they did before they joined, and whether that change in behavior is large enough to justify the cost of points, free items, and the staff time spent at the point of sale. Looking across the consumer research published through early 2014, the answer is a clearer “yes” than skeptics tend to assume, though the magnitude depends heavily on the segment of guest you are measuring.
This piece pulls together what the public data actually shows about loyalty program impact on restaurant visit frequency, where the numbers come from, and how operators should interpret the headline figures they see in trade press.
What the headline numbers really measure
Reports that show loyalty members visiting “30 percent more often” or generating “20 percent higher annual spend” are almost always comparing two different groups of people: members and non-members. That comparison is useful, but it is not the same as a true incremental lift measurement. Some portion of a loyalty member’s elevated frequency is selection bias. Guests who join a rewards program at a chain they already love are, by definition, fans of that brand. They would have visited more than the average customer even without a card in their wallet.
The honest way to read a “members visit 35 percent more” claim is to separate three effects:
- Selection effect. Heavy users self-select into the program. This is the largest single driver of the gap.
- Behavior change. Members shift trips from a competitor to the rewards-issuing brand to accumulate points faster, or time their visits around bonus offers.
- Reactivation. Members who had lapsed receive an email or push and come back in.
Bond Brand Loyalty’s annual loyalty reports, NRA consumer tracking, and Paytronix benchmarking data have all converged on a similar story over the past several years: roughly one third to one half of the visit gap between members and non-members is genuine incremental behavior, with the remainder attributable to selection. That still leaves a meaningful lift, but operators who treat the entire reported gap as program-driven will overstate ROI.
Where the visit lift actually shows up
Across casual dining brands, the visit lift from loyalty membership concentrates in two segments. The first is the “regular who became more regular” — guests who already visited monthly and now visit every three weeks because a free entree is in reach. The second is the “occasion guest who added a trip” — guests who visited quarterly and now visit every other month because a birthday reward or a bonus point promotion pulled them in.
What the data consistently does not show is a large lift among truly light users. A guest who visits a brand twice a year before joining usually visits twice a year afterward. The promotional reward is not strong enough to override their default rotation of restaurant choices. This is one of the more important findings for operators thinking about acquisition: blanket sign-up incentives that drag in light users inflate enrollment numbers without producing much incremental revenue.
For more on how this plays out in benchmarking averages, see our companion piece on how many restaurant rewards programs the average consumer belongs to.
The role of program design in lift size
Two programs at similar brands can produce very different visit lifts depending on how the earn and burn mechanics are tuned. The factors that most consistently correlate with stronger member behavior change are:
- Time to first reward. Programs that deliver a tangible reward within the first three visits significantly outperform programs that require eight or more visits before the first redemption.
- Reward relevance. Free items the member would have purchased anyway produce more visit lift than discounts on items they rarely buy. A free entree at a steakhouse beats 15 percent off a dessert.
- Surprise and delight elements. Unexpected bonus points or off-cycle offers consistently produce short-term visit spikes among mid-tier members.
- Tiering. Programs with visible status tiers create a goal gradient effect — members who are close to the next tier visit more often to cross the threshold.
Programs that combine all four levers tend to report the visit lift numbers in the 30 to 40 percent range. Programs that rely on a single mechanic, usually a flat earn-and-burn structure, tend to settle in the 10 to 15 percent range.
What the 2014 data shows about redemption
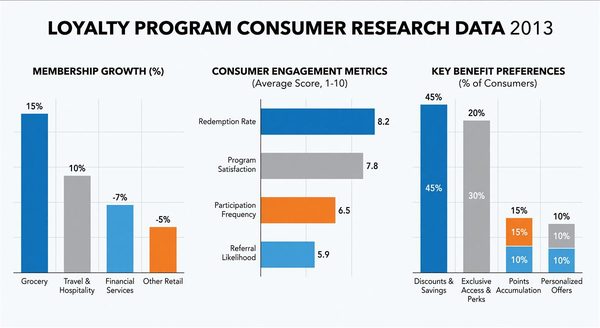
Redemption rate — the percentage of earned rewards that members actually use before expiration — is the single most underappreciated metric in restaurant loyalty. High enrollment with low redemption is a sign of a broken program, not a successful one. Members who never redeem are members who do not perceive the program as valuable, and they will not be there when the next competitor launches a more compelling offer.
The 2014 consumer data suggests that healthy casual dining programs run redemption rates in the 50 to 70 percent range on issued rewards. Programs below 30 percent typically suffer from one of three problems: rewards expire too quickly, the redemption process is awkward at the point of sale, or members forget the reward exists because the brand does not remind them. Our loyalty program tune-up guide walks through how to diagnose each of these issues.
How operators should read visit-lift studies
When a vendor or industry report claims a specific visit lift percentage, the questions worth asking before quoting the number internally are:
- Was the comparison group matched on prior visit frequency, or was it all non-members?
- Did the study control for promotional activity that ran during the measurement window?
- Was the lift measured against the same guests before and after enrollment, or across two different cohorts?
- What time horizon does the lift represent — the first 90 days after enrollment, or year-over-year?
The most rigorous studies report lift on a matched-cohort basis with a defined measurement window, and they separate the first-90-days “honeymoon” lift from the steady-state lift that persists into year two. Both numbers are useful, but they tell different stories. Honeymoon lift tells you the program works for acquisition. Steady-state lift tells you the program works for retention.
Implications for 2014 program planning
For operators planning launches or refreshes in 2014, the consumer data points to a clear set of priorities. Build for the heavy and mid-tier guest, not the light user. Get the first reward into the member’s hands quickly. Make rewards items the guest already wants. Measure redemption as carefully as enrollment. And expect a real, but moderate, incremental visit lift — somewhere in the range of one additional visit per quarter for an engaged mid-tier member, which is enough to drive meaningful same-store sales contribution when scaled across an active member base of any size.
The brands that will lead the casual dining loyalty space over the next few years are not the ones with the largest enrollment counts. They are the ones with the highest ratio of active, redeeming, frequency-shifting members to total enrolled accounts.
FAQ
How much do loyalty program members really visit more than non-members? Across casual dining, members typically visit 25 to 40 percent more often than non-members, but a meaningful share of that gap reflects selection bias rather than program-driven behavior change. The genuinely incremental lift is usually one third to one half of the headline number.
What is a healthy redemption rate for a restaurant loyalty program? Healthy casual dining programs run redemption rates between 50 and 70 percent of issued rewards. Programs below 30 percent typically have expiration, point-of-sale friction, or communication problems.
Do loyalty programs convert light users into frequent guests? Generally no. Loyalty programs are most effective at increasing frequency among guests who are already mid-tier or heavy users of the brand. Light users tend to keep their existing visit pattern even after enrollment.
How long does the visit lift from joining a loyalty program last? The first 90 days after enrollment typically show the largest lift — the “honeymoon” period — followed by a smaller but durable steady-state lift that can persist for years if the program continues to deliver relevant rewards.
Further Reading from Authoritative Sources
- National Retail Federation — NRF and its restaurant industry research partners produce the consumer tracking data on loyalty program participation rates cited in this article’s visit-frequency analysis.
- Harvard Business Review — HBR research on causal attribution in marketing programs supports the article’s methodology for correctly interpreting loyalty program visit-lift claims.